


What are the odds of winning with online bingo?
Bingo is a popular game of chance where players compete to win a prize or jackpot. While there are many variations the game generally consists of each player buying one or more card(s) containing a random assortment of numbers arranged in a square or rectangular table. Numbers are then called randomly (either being selected by an electronic random number generator or, more traditionally, by drawing numbered balls from a cage) and each player marks (or daubs) the called numbers on their card(s). The winner is the first player to daub all the numbers in any single column, row or diagonal on one of their cards and shout “BINGO” (the daubed squares required to win is known as the win pattern and may vary from simple rows and columns to other shapes and even small “pictures” that may be formed on the card).
Disclosure: Busy Bee Bingo may receive compensation from listed brands. Read full disclosure.
The ease and convenience of online gaming in recent years has shifted the popularity of Bingo from traditional Bingo halls to the domain of the world wide web. While the essential structure of the game remains the same in the online environment, some changes, such as automated daubing and the large number of game variations available from the same location (the comfort of the player’s own home), bring some minor changes to this centuries-old game.
This article investigates the statistics related to online Bingo using Monte Carlo methods: statistical inference by applying large numbers of random circumstances upon various versions of the game. Being a game based on random chance, Monte Carlo methods are particularly suitable for this investigation.
Monte Carlo model
The statistical inference used in this article is produced by playing simulated Bingo games. The law of large numbers states that as the sample size (number of games in this case) grows, the average of the population (an infinite sample size, or the expected value if infinitely many Bingo games are played) is approached. This approach is called convergence and the number of games required to achieve convergence is many thousands, depending on the statistic required. This necessitates the use of computerised simulation of these games. Computers can not truly generate random numbers and instead rely on algorithms producing pseudo-random numbers: numbers which appear to be random, but are in fact deterministic. The period of a pseudo-random number generator is the number of steps the algorithm takes to return to a previous state. This analysis makes use of the Mersenne Twister algorithm, which is a pseudo-random number generator that is popular for being fast and having a very high period of 219937-1. Since this study only utilises and estimated 230 random numbers, the Mersenne Twister is more than capable of providing completely randomized inputs.
Card and ball number variations
The simplicity of the base Bingo game has allowed a large number of variations in game style, as well as win patterns, to come to life. The rules of some popular versions, also the ones that are statistically compared in this article, are explained below. It is important for players to make sure they know the rules and win patterns of the specific games they are playing as these may vary slightly (or widely) between different bingo sites.
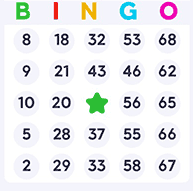
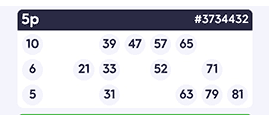
75-ball Bingo
As the name indicates, this game is played using 75-balls. Cards (see Figure 1) consist of 5 rows and 5 columns, with the first column containing a random selection of numbers in the range 1-15, the second 16-30 and so on until the last column which contains a random selection from the numbers 60-75. The center square (third column, third row) of each card does not contain a number and is considered “free”, counting as being daubed from the start. As such it may for part of a win pattern. Wins are registered by completing 1 or 2 lines, all 5 lines (also known as “Full house” or “Blackout”) or any other variation possible within the card.
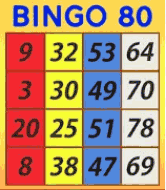
80-ball Bingo
This version is a variation of the 75-ball game, with the only differences being the number of balls and the card layout. The card consists of 4 rows and 4 columns. The first column may contain numbers between 1-20, the second, 21-40, the third 41-60 and the fourth 61-80. There are no free squares. A win is registered by daubing all the numbers in 1, 2, 3 or all 4 rows or columns, or any variation possible within the card layout.
90-ball Bingo (Most Common)
This version of Bingo differs from the two previous versions in several key ways: Firstly, it is the version primary played in the UK. Each card (strip) consists of 6 “tickets” of 3 rows and 9 columns. Each row on the card contains 5 numbers and 4 empty squares, while each column contains 10 numbers, with the first containing numbers 1-9, the second 10-19, the third 20-29 and so on until the last column, which contains the numbers 80-90. Each of the 90 numbers in the game appears on the card exactly once.
Wins in this version are registered only by line, with the completion of all 5 numbers on a line being called a 1-line win. Common win variation are, the 2-line or 3-line (“Full house”) wins, which are achieved by completing 2 or all 3 lines respectively, on the same ticket (not across the entire card).
Expected results
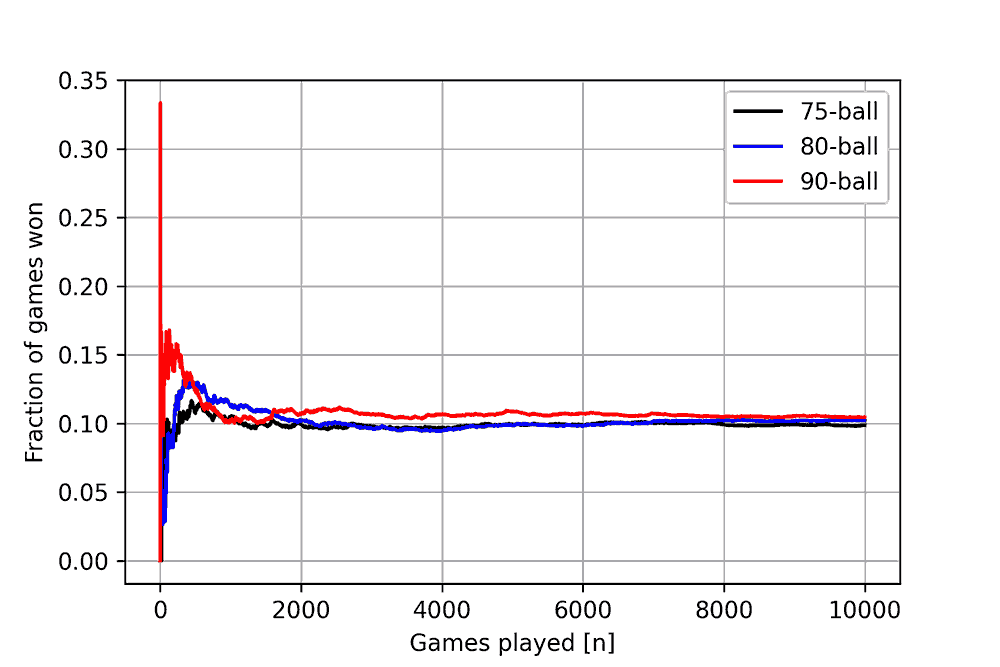
The expected results for online Bingo, as for traditional Bingo, being a game of pure chance, is that every card would have the same chance of winning in a particular game. To verify the Monte Carlo model of the Bingo statistics, this expectation is tested first. The winning statistics of a single player, arbitrarily called John, is tracked. To start with, John plays 10 000 (virtual) games of each analysed Bingo type (75-, 80- and 90-ball) against 9 other competitors, each having only one card per game. You would expect John to win (on average) 10% of the games played and this is confirmed by Figure 4, with the fraction of games won converging to 0.10 (10% of games played). The initial variation in the fraction of games won is due to the random chance of winning having a larger effect initially, while the effect of individual games (due to the law of large numbers) diminish at higher game counts.
Simultaneous wins (where more than one player wins on the same drawn ball) is calculated as a “partial” win, with John scoring 1/w for that game, and w being the number of simultaneous winners. The inclusion of partial wins is important to avoid increased (greater than expected) win fractions.
Further investigation of the expected results is performed by simulating games with varying numbers of players, 1000 times each. In Figure 5, the results of this is compared to the curve y=1/x, with x denoting the number players and y denoting the win fraction; they are found to match closely for all three game types.
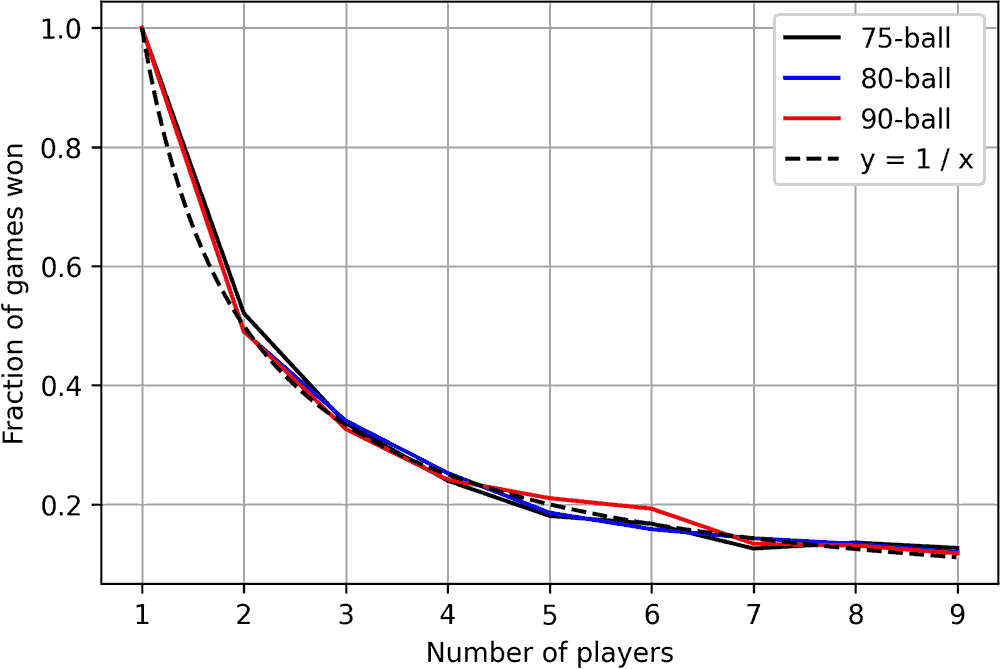
This confirms the expected results. Larger numbers of players, especially as found on free Bingo sites where many players tend to join (given that it’s free of charge), lead to diminished odds of winning.
Purchasing multiple cards for a single game
If John increases the number of cards he plays (as long as all other players don’t do the same) his odds of winning increase, as seen in Figure 6. This relationship is nearly linear (double the number of cards doubles his probability of winning) when his cards make up a smaller portion of all the cards (see the steep slope on the left side of Figure 6), but the return diminishes when his cards make up a larger portion (flattened slope on the right-hand side of Figure 6).
The question arises as to which is better: to play multiple cards in a single game, or to play multiple games with one card each. For this comparison, due to the complexity of “partial wins” it is more suitable to use normal statistical calculations. These are also more accurate (being analytical rather than numerical solutions) for the purpose of the comparisons done below, since small errors may yield relatively large effects when the compared values are close to each other. The equation to calculate the probability of John winning a game when buying multiple cards is:
where PN is the probability of winning, N is the number of cards played by John, and X is the total number of players in the game. Comparing this to the probability of winning a game if multiple games are played (each with a single card and all having the same number of opponents):
where Pn is the probability of winning one game and n is the number of games played. These values are compared in Figure 7 for a small number (10) and large number (100) of players by setting n = N = m: in both cases buying m cards, but in the one case, playing them all in one game, compared to playing 1 card in m games.
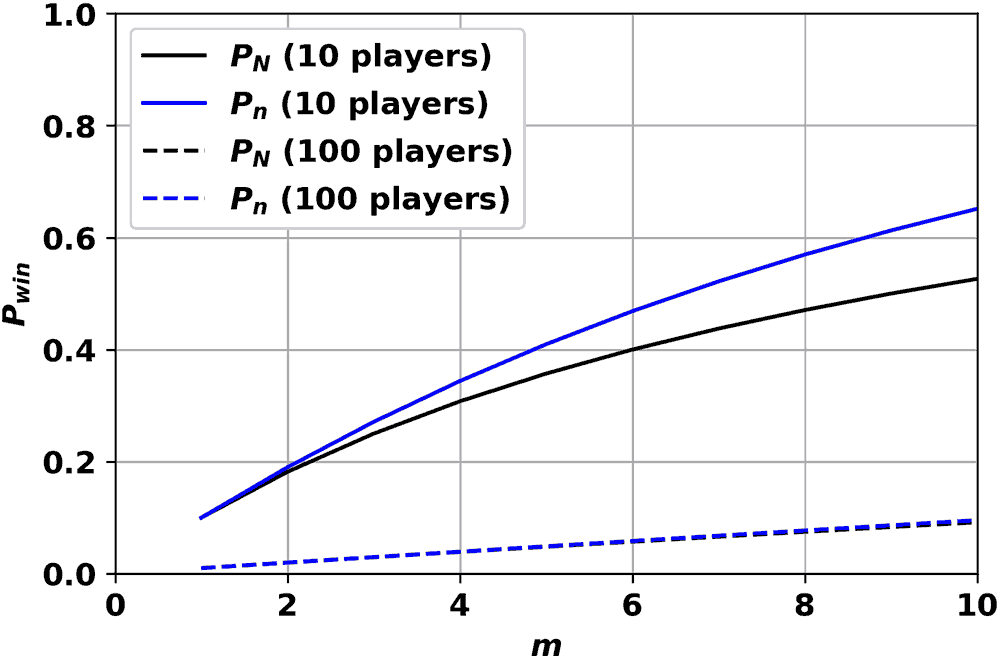
It is clear that for a small number of players, Pn is much larger than PN, with the difference growing with m, while for a large number of players, the values are nearly identical. Figure 8 shows the relative difference in win probability between the two for each case. While the difference for the game with a large number of players remains below 5%, the difference rises to above 20% for a game with a small number of players.

It is therefore better (greater odds of winning for the money spent) to play a single card in multiple games than buying multiple cards in a single game. This effect is the greatest in games with few players and may be considered negligible for games with many players.
Continuation after winning the first or second Jackpot
As you may think, after winning with one pattern, John’s chances of winning with a second or third pattern becomes greater, since he is already “part of the way there”. Exactly how much greater your chances are of winning further prizes after initial wins is investigated now. 10 000 games of each type (75-, 80- and 90-ball) are simulated. All games are 10-player games and as such, the normally expected win fraction is 0.10.
Table 1: Change of odds when continuing a game.
| 1-line win | 2-line win | Full house win | 2-line win after 1-line win | Full house win after 1-line win | Full house win after 2-line win | Full house win after 1- and 2-line win | ||
|---|---|---|---|---|---|---|---|---|
| 75-ball | Number | 1011,12 | 996,50 | 1039,43 | 263,58 | 174,65 | 209,12 | 53,67 |
| Fraction | 0,101 | 0,0997 | 0,104 | 0,261 | 0,173 | 0,210 | 0,204 | |
| 80-ball | Number | 987,62 | 954,50 | 1024,53 | 263,50 | 164,00 | 210,59 | 67,50 |
| Fraction | 0,0988 | 0,0955 | 0,102 | 0,267 | 0,166 | 0,221 | 0,256 | |
| 90-ball | Number | 967,67 | 1016,58 | 973,62 | 175,33 | 122,75 | 268,83 | 45,42 |
| Fraction | 0,0978 | 0,102 | 0,0974 | 0,181 | 0,127 | 0,264 | 0,259 |
From Table 1 it is clear that (compared to the expected win fraction of 10 %) significantly increased odds may be expected to win a 2-line after a 1-line win (18-27 %) and a Full house after a 2-line (21-26,5 %), while a reasonable increase may be expected to win a Full house after a 1-line win (12-17%). No significant change is observed in the rate of Full house wins when comparing cases where the player won the 2-line before and the case where he won both the 1- and 2-line.
It is also observed that the win fraction of 90-ball bingo for a 2-line win after a 1-line win is significantly lower (18%) than the other two types (26%). This is likely due to different layout of 90-ball Bingo having a greater chance of getting a 2-line win on a different ticket (on the same card) than the 1-line win.
Although Bingo is not like Poker, where you can potentially win more money (by placing higher bets during the game) to take advantage of the increased odds, this knowledge may lead to increased expectation, excitement and enjoyment of the game of Bingo.
Game duration
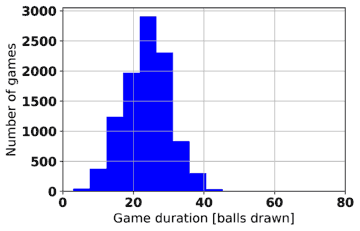
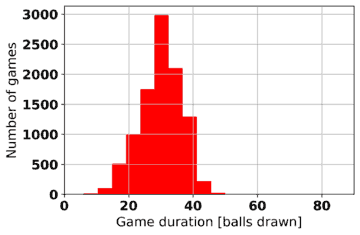
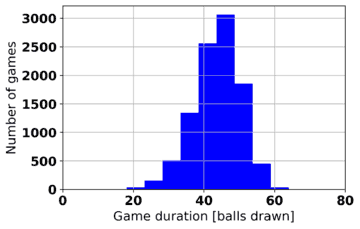
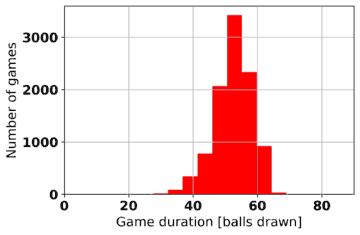
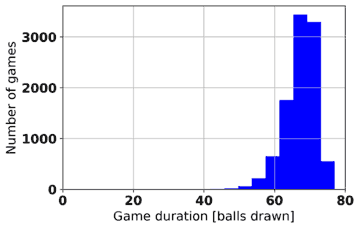
Game duration is another statistic that can be extracted from computer-simulated Bingo games. Table 2 shows histograms of game durations for various game types and win patterns. In each case, 10,000 games of 10 players each are played and the number of balls drawn before a winner (or winners) is declared is recorded. As may be expected, the game duration is longer the greater the number of lines needed to win.
Table 2: Comparison of game durations for various game types and win patterns.
| 75-ball | 80-ball | 90-ball | |
|---|---|---|---|
| 1-line | 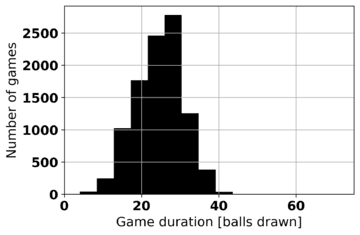 |
 |
 |
| 2-line | 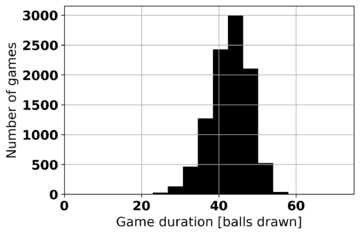 |
 |
 |
| Full house | 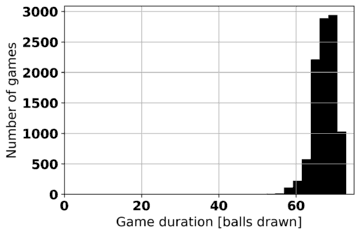 |
 |
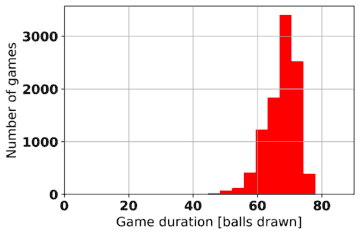 |
Table 3 provides the average game lengths for the game types and win patterns.
Table 3: Average game length (in balls drawn) for 10 player games for game types and win patterns
| 75-ball | 80-ball | 90-ball | |
|---|---|---|---|
| 1-line | 24,49 | 23,82 | 29,96 |
| 2-line | 42,99 | 43,64 | 52,50 |
| Full house | 67,40 | 67,61 | 67,50 |
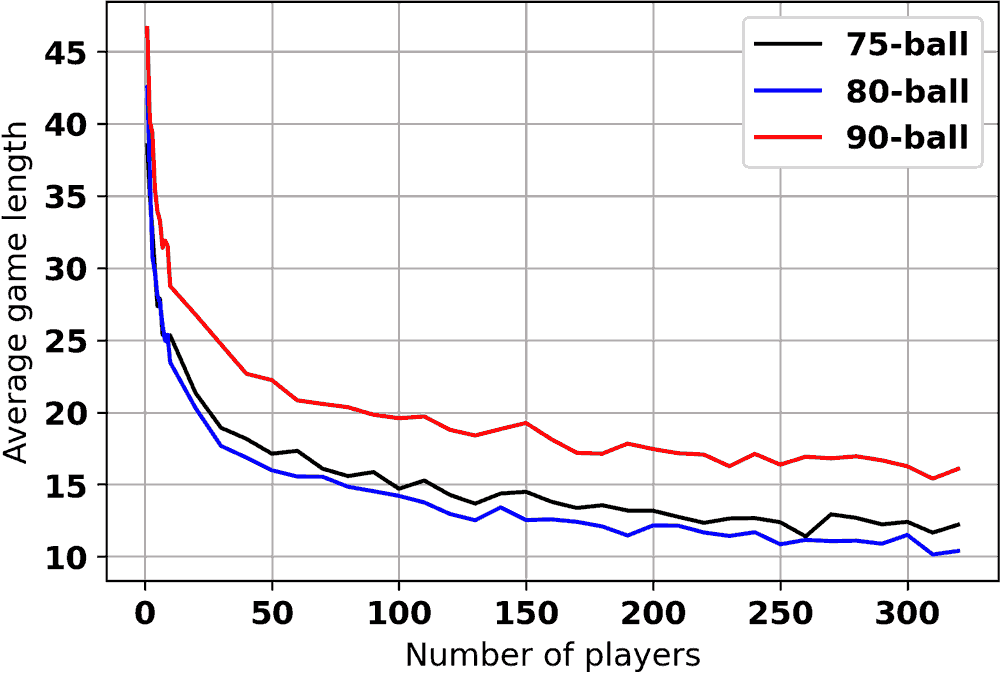
As may be expected, the game duration is also dependent on the number of players in the game. This is due to the greater chance of a single player attaining a winning pattern if the number of players are higher. To investigate this, the number of the players in the game were varied and the average game length (out of 100 games played for each game type) are plotted. Only 1-line game length variations are shown.
The advantage of automatic daubing
If John is a forgetful player when playing traditional Bingo, who enjoys making small talk or having a drink during his Bingo game, he has a chance of missing his win because he forgot to daub one (or more) of the called numbers. This obviously reduces his odds of winning, but by how much exactly?
To study this, a “forgetfulness” factor is added to the Monte Carlo model, giving John a chance, ranging from 0% to 20% to forget to daub any number on his card(s). All simulations are done for a 10-player game, with John being the only player suffering from forgetfulness. Figure 10 shows the reduction in win ratio caused by forgetfulness, as well as a linear regression of the results. A reasonable forgetfulness factor of an inattentive person may be 1-2% (possibly higher if the player has more cards to pay attention to), which translates to expected win rates of 9.68-9.36%, which may not seem much reduced from an normally expected win rate in a 10-player game of 0.10. Your overall chance of winning is, however, reduced by 3.2-6.4% (of the original 10%), which is significant.
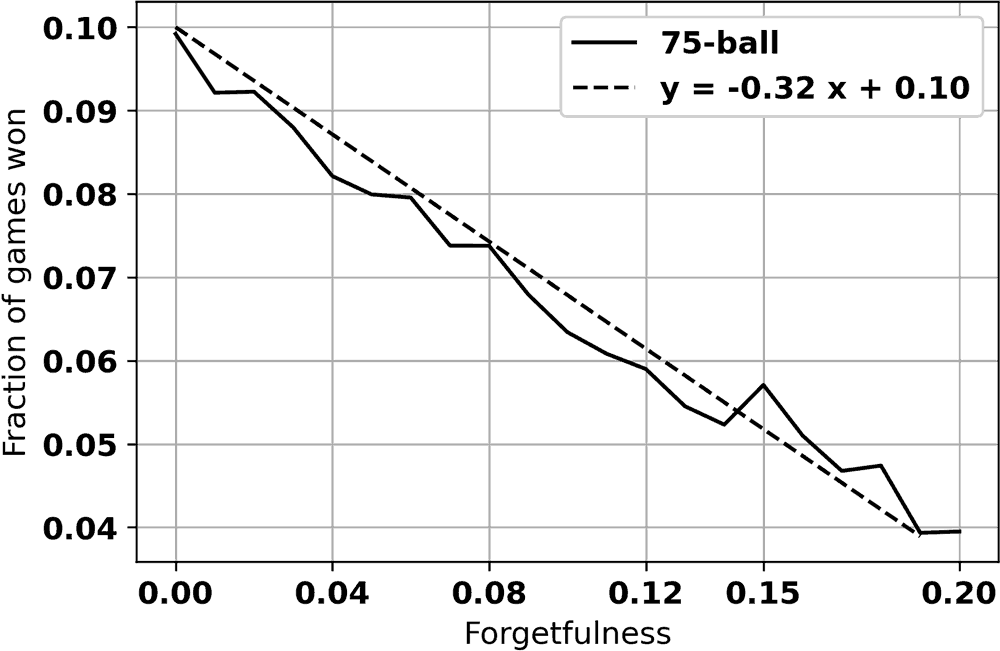
For this reason, the auto-daubing feature of Online Bingo could be a significant contributor to John’s winning odds. The change in odds displayed here will be magnified for games with more players.
Progressive Jackpot Bingo
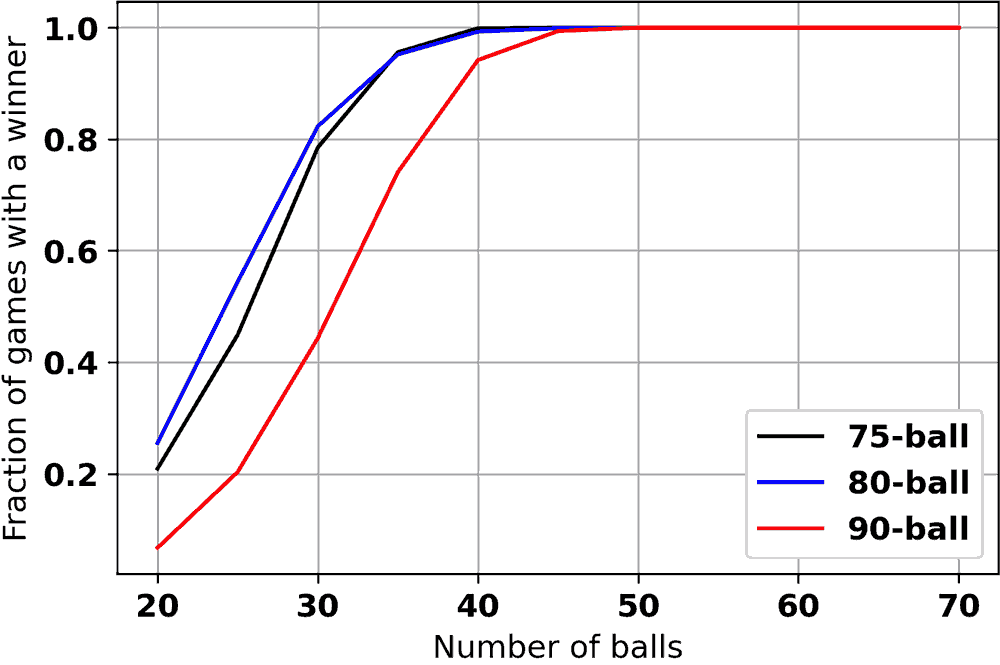
A variation on traditional Bingo, known as Progressive Jackpot Bingo, consists of the prize being transferred to the next game if there was no winner after a certain number of balls. This does not affect the overall odds of winning (as long as you stay in the game) since the winner simply gets double (or more) prizes when one is announced, but it does affect the chance of there being a winner in any particular game.
To model this, a 10 player game is repeated again and the Fraction of games having a winner is plotted as a function of the game length.
Conclusion
While Bingo is a game of chance, there are some strategies that may be employed to increase your chances of winning. The first and most obvious strategy is to play a game with as few opponents as possible. Secondly, you can increase your odds of winning a particular game by buying multiple cards for that game, however, it has been shown that it is better to buy single cards in multiple games. For the same number of opponents, this gives better odds of winning a game for the same investment. Buying multiple cards in a single game carries very little penalty if there are many players in a game, so if your time or play style don’t allow joining many different games, multiple cards should only be bought in games with many opponents.
It is also shown that the automatic daubing available on online platforms can yield a moderate improvement in winning odds for players who tend to be forgetful or who struggle to concentrate when playing multiple cards at the same time.